Meteorological Data
Mattia Rossi
2019-10-04
Meteo.RmdExplore the Database
The database we use in this Package is the CKAN API for meteorological data exposed by the OpenData Portal South Tyrol.
Since Version 0.2 we can extract all Metainformation by using getMeteoInfo
##     SCODE          NAME_D         NAME_I          NAME_L          NAME_E
## 1 00390SF Graun Schöneben Curon Belpiano Graun Schöneben Graun Schöneben
## 2 00390SF Graun Schöneben Curon Belpiano Graun Schöneben Graun Schöneben
## 3 00390SF Graun Schöneben Curon Belpiano Graun Schöneben Graun Schöneben
## 4 00390SF Graun Schöneben Curon Belpiano Graun Schöneben Graun Schöneben
## 5 00390SF Graun Schöneben Curon Belpiano Graun Schöneben Graun Schöneben
## 6 00390SF Graun Schöneben Curon Belpiano Graun Schöneben Graun Schöneben
##    ALT    LONG     LAT   TYPE                  DESC_D
## 1 2040 10.4979 46.8064     LT          Lufttemperatur
## 2 2040 10.4979 46.8064     WR            Windrichtung
## 3 2040 10.4979 46.8064     WG     Windgeschwindigkeit
## 4 2040 10.4979 46.8064     HS              Schneehöhe
## 5 2040 10.4979 46.8064 WG.BOE Windgeschwindigkeit Böe
## 6 2040 10.4979 46.8064     LF    relative Luftfeuchte
##                  DESC_I              DESC_L UNIT                    DATE
## 1 Temperatura dell´aria Temperatura dl’aria   °C 2019-10-04T13:00:00CEST
## 2   Direzione del vento    Direzion dl vënt   °  2019-10-04T13:00:00CEST
## 3    Velocità del vento       Slune dl vënt  m/s 2019-10-04T13:00:00CEST
## 4 Altezza neve al suolo     Autëza dla nëif   cm 2019-10-04T13:00:00CEST
## 5      Velocitá raffica       Slune dl vënt  m/s 2019-10-04T13:00:00CEST
## 6      Umidità relativa        Tume relatif    % 2019-10-04T13:00:00CEST
##   VALUE
## 1   2.6
## 2   4.0
## 3   0.2
## 4  -1.1
## 5   1.4
## 6 64.4## Simple feature collection with 6 features and 13 fields
## geometry type: POINT
## dimension: XY
## bbox: xmin: 10.4979 ymin: 46.8064 xmax: 10.4979 ymax: 46.8064
## epsg (SRID): 4326
## proj4string: +proj=longlat +datum=WGS84 +no_defs
## SCODE NAME_D NAME_I NAME_L NAME_E
## 1 00390SF Graun Schöneben Curon Belpiano Graun Schöneben Graun Schöneben
## 2 00390SF Graun Schöneben Curon Belpiano Graun Schöneben Graun Schöneben
## 3 00390SF Graun Schöneben Curon Belpiano Graun Schöneben Graun Schöneben
## 4 00390SF Graun Schöneben Curon Belpiano Graun Schöneben Graun Schöneben
## 5 00390SF Graun Schöneben Curon Belpiano Graun Schöneben Graun Schöneben
## 6 00390SF Graun Schöneben Curon Belpiano Graun Schöneben Graun Schöneben
## ALT TYPE DESC_D DESC_I
## 1 2040 LT Lufttemperatur Temperatura dell´aria
## 2 2040 WR Windrichtung Direzione del vento
## 3 2040 WG Windgeschwindigkeit Velocità del vento
## 4 2040 HS Schneehöhe Altezza neve al suolo
## 5 2040 WG.BOE Windgeschwindigkeit Böe Velocitá raffica
## 6 2040 LF relative Luftfeuchte Umidità relativa
## DESC_L UNIT DATE VALUE
## 1 Temperatura dl’aria °C 2019-10-04T13:00:00CEST 2.6
## 2 Direzion dl vënt ° 2019-10-04T13:00:00CEST 4.0
## 3 Slune dl vënt m/s 2019-10-04T13:00:00CEST 0.2
## 4 Autëza dla nëif cm 2019-10-04T13:00:00CEST -1.1
## 5 Slune dl vënt m/s 2019-10-04T13:00:00CEST 1.4
## 6 Tume relatif % 2019-10-04T13:00:00CEST 64.4
## geometry
## 1 POINT (10.4979 46.8064)
## 2 POINT (10.4979 46.8064)
## 3 POINT (10.4979 46.8064)
## 4 POINT (10.4979 46.8064)
## 5 POINT (10.4979 46.8064)
## 6 POINT (10.4979 46.8064)Download from Database
Analogous to the MONALISA Database in the example before we can access the database with the downloadMeteo function providing key input sich as the code of a single station, the sensor code corresponding to a product or a daterange. By default the data is stored in memory. If you want to download it you need to provide a path and set the csv variable as TRUE
s <- "2017-01-01 00:00"
e <- "2018-01-01 00:00"
a<-downloadMeteo2(station_code = "02500MS",
                 sensor_code = "LT",
                 datestart = s,
                 dateend = e)

a
## # A tibble: 52,518 x 6
## TimeStamp SCODE Sensor Start End Value
## <dttm> <fct> <fct> <chr> <chr> <dbl>
## 1 2017-01-01 00:00:00 02500MS LT 20170101 20180101 1.9
## 2 2017-01-01 00:10:00 02500MS LT 20170101 20180101 1.8
## 3 2017-01-01 00:20:00 02500MS LT 20170101 20180101 1.6
## 4 2017-01-01 00:30:00 02500MS LT 20170101 20180101 1.5
## 5 2017-01-01 00:40:00 02500MS LT 20170101 20180101 1.5
## 6 2017-01-01 00:50:00 02500MS LT 20170101 20180101 1.6
## 7 2017-01-01 01:00:00 02500MS LT 20170101 20180101 1.4
## 8 2017-01-01 01:10:00 02500MS LT 20170101 20180101 1.5
## 9 2017-01-01 01:20:00 02500MS LT 20170101 20180101 1
## 10 2017-01-01 01:30:00 02500MS LT 20170101 20180101 1.1
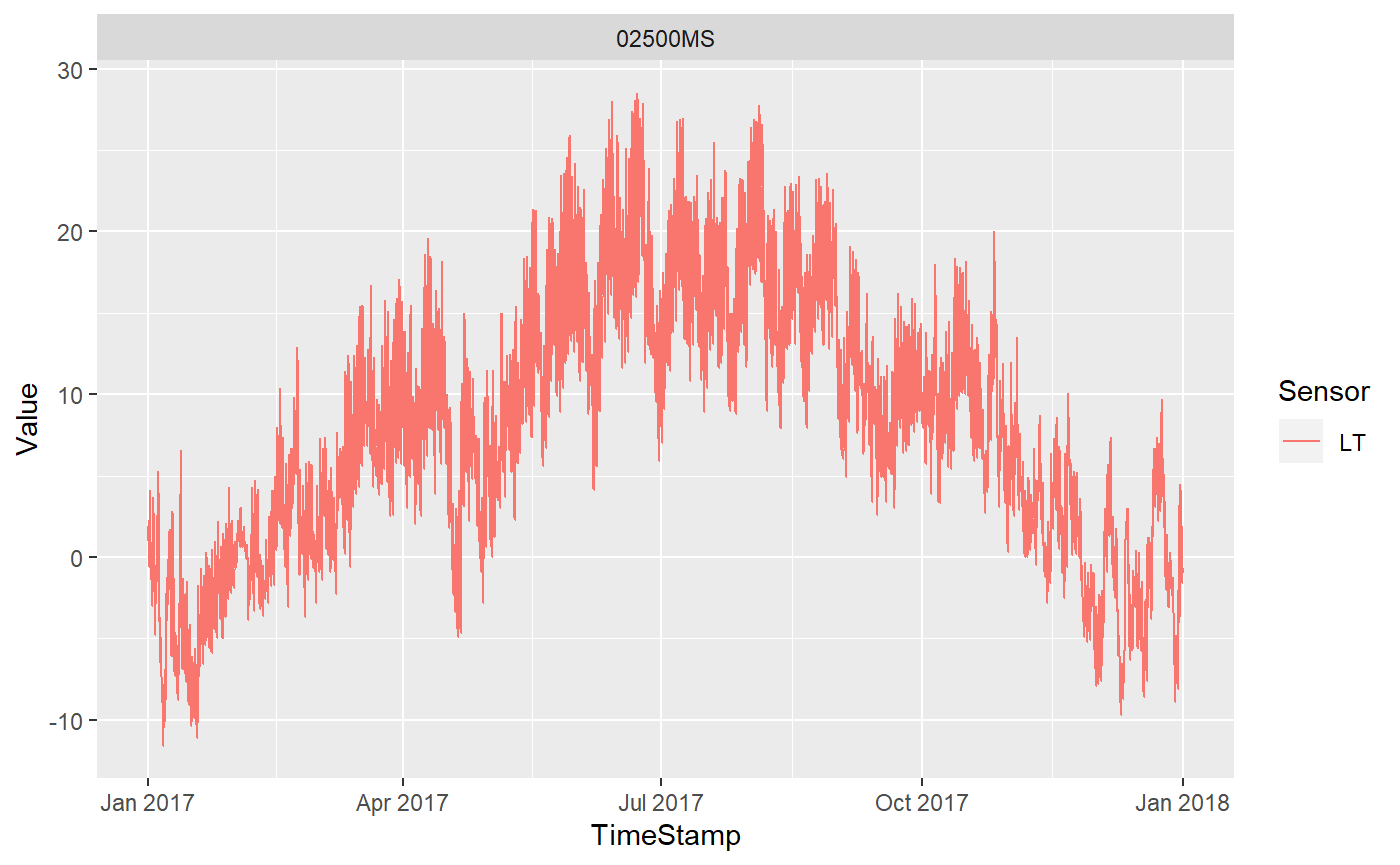
## # ... with 52,508 more rowsPlot the Results
And now we can simply Plot the Results using GGplot2
As before the Plots can be done with Leaflet. This could be interesting to explore before the actual data retrieval to diminish the number of processed station data
Combine with other Data
Now if you want t import other data such as Shapefiles or point files indicating your area of interest you can use some predefined functions. In case yo would like to reduce the dimensionality of the acquired dataset by providing a buffer around apoint file you can use the buffmeteo function. If you want to plot the buffer Zone just add addCircles to the leaflet or use the getBuffershp option in the buffmeteo function. In this example we use a buffer of 10km around one point to see which stations lie within that range. This can be done either graphically
## Reading layer `Test' from data source `C:\Users\MRossi\Documents\07_Codes\MonalisR\vignettes\data\Test.shp' using driver `ESRI Shapefile'
## Simple feature collection with 115 features and 8 fields
## geometry type:  POINT
## dimension:      XY
## bbox:           xmin: 611860.4 ymin: 5122613 xmax: 757831.9 ymax: 5213918
## epsg (SRID):    NA
## proj4string: +proj=utm +zone=32 +ellps=GRS80 +units=m +no_defsor by extracting the stations within the 10km buffer zone around the imported Point.
## Simple feature collection with 6 features and 13 fields
## geometry type:  POINT
## dimension:      XY
## bbox:           xmin: 11.1855 ymin: 46.2362 xmax: 11.1855 ymax: 46.2362
## epsg (SRID):    4326
## proj4string:    +proj=longlat +datum=WGS84 +no_defs
##       SCODE NAME_D  NAME_I NAME_L NAME_E ALT   TYPE               DESC_D
## 615 88820MS Salurn Salorno Salurn Salurn 212 LD.RED            Luftdruck
## 616 88820MS Salurn Salorno Salurn Salurn 212     SD    Sonnenscheindauer
## 617 88820MS Salurn Salorno Salurn Salurn 212     LF relative Luftfeuchte
## 618 88820MS Salurn Salorno Salurn Salurn 212     LT       Lufttemperatur
## 619 88820MS Salurn Salorno Salurn Salurn 212     GS      Globalstrahlung
## 620 88820MS Salurn Salorno Salurn Salurn 212      N         Niederschlag
##                    DESC_I              DESC_L UNIT                    DATE
## 615 Pressione atmosferica       Druch dl’aria  hPa 2019-10-04T13:20:00CEST
## 616  Durata soleggiamento    Dureda dl surëdl    s 2019-10-04T13:20:00CEST
## 617      Umidità relativa        Tume relatif    % 2019-10-04T13:20:00CEST
## 618 Temperatura dell´aria Temperatura dl’aria   °C 2019-10-04T13:20:00CEST
## 619   Radiazione globale   Nraiazion globala  W/m² 2019-10-04T13:20:00CEST
## 620        Precipitazioni              plueia   mm 2019-10-04T13:20:00CEST
##      VALUE                geometry
## 615 1014.1 POINT (11.1855 46.2362)
## 616    0.0 POINT (11.1855 46.2362)
## 617   54.8 POINT (11.1855 46.2362)
## 618   13.3 POINT (11.1855 46.2362)
## 619   71.2 POINT (11.1855 46.2362)
## 620    0.0 POINT (11.1855 46.2362)